Brick sizes
Introduction
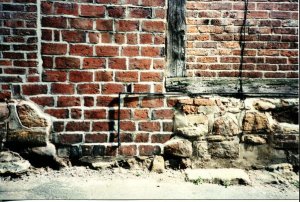
Part of the interest of brickwork is the ability to observe subtle (and some not so subtle) differences in size as you walk round different towns. When you 'get your eye in' you will find that different sized bricks, and especially bricks where the sides are in a different ratio, stand out and catch your eye, even before you resort to a ruler.
Several things influenced the size of bricks. They mustn't be too big, or they will be too heavy and awkward to pick up with one hand, while applying mortar with a trowel held in the other. They mustn't be too small, or a wall will need more of them, and more mortar, and more time to lay it.
 In modern times most bricks in UK are made to a standard size of 65x102.5x215mm, and laid with nominal 10mm mortar joints, but in former times the size varied quite a lot.
Some early medieval bricks were as big as 13"x6"x2". Late 15th century bricks were mostly about 9½"x4½"x2". A charter in 1571 specified 9"x4½"x2¼" and in 1625 the size was regulated 9"x4½"x3". In the 18th century, Parliament specified 8½"x4"x2½", which is equivalent to the modern metric brick of 215mm x 102.5mm x 65mm.
What upset the apple cart was a brick tax imposed by the government in 1784. The tax was levied per brick, and brick makers responded by making much larger bricks, so fewer were needed for a given size wall and the tax was correspondingly less. An extreme case was Joseph Wilkes of Measham, who produced bricks double the normal size (110x110x235mm) known locally as 'Jumbies' or Wilkes's Gobbs'', see right. The government later set an upper limit of 150 cubic inches (10"x5"x3") for a 'brick, which was still much larger than bricks had been before the tax.
The tax was repealed in 1850, but by this time, many brick makers, especially in the Midlands and North, had moved from hand-made to machine-made bricks and invested heavily in machinery to make them. That made it harder to revert to the smaller sizes, which meant that big bricks persisted for a long time afterwards. As a result, in older buildings around the country you can find many different sizes, with bigger bricks being more common as you move farther north. Modern buildings mainly use standaard size bricks (BS 3921 from 1965 and BS EN 771-1 from 2007). (There is a comparison of standard sizes in different countries here.)
Geographical spread
I have measured the dimensions of bricks in around 250 different buildings across the country. This wasn't a systematic survey, I just measured any interesting looking bricks whenever I had the chance. I measured the visible faces of what looked like typical bricks in situ, which is less accurate, and may give a smaller measurement, than the procedure described in BS EN 771-1, but even allowing for that, the variation between bricks in different buildings is quite noticeable.
The volume of the bricks I measured ranged from under 1 litre to nearly 3 litres, compared with 1.4 litres for a standard modern brick. The standard allows for tolerances on all dimensions, but even allowing for extreme tolerances, the volume of a 'standard' brick could only vary between about 1.3 and 1.6 litres.
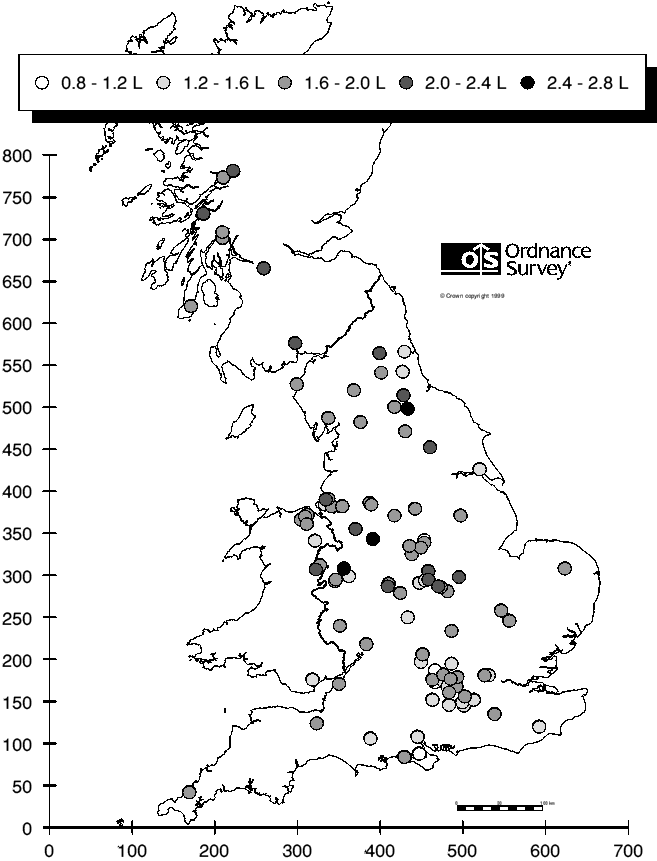
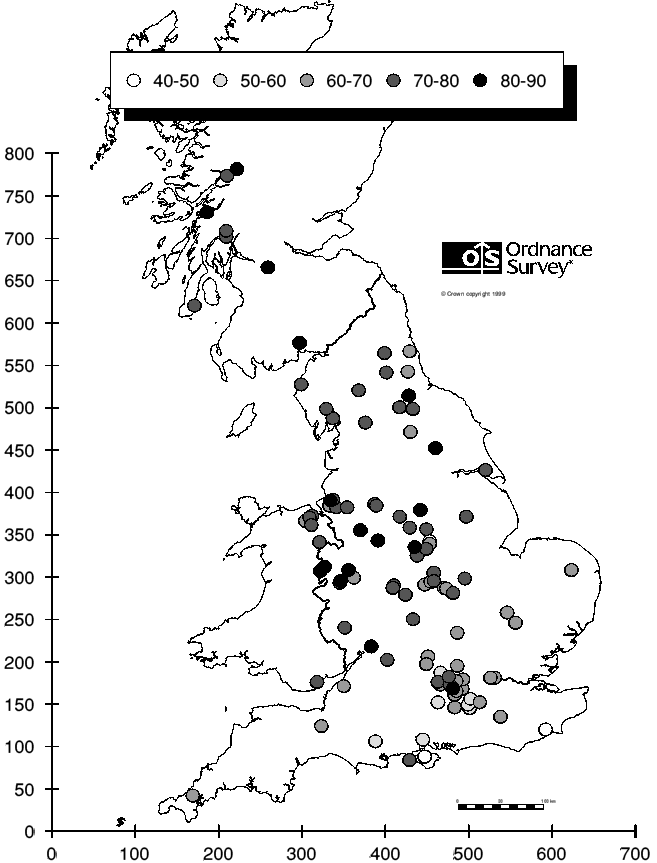
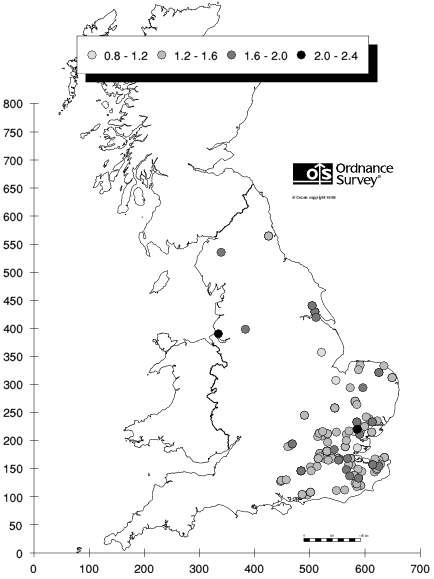
The map gives a visual indication of the variation in brick volume. Each blob shows where bricks the first 120 bricks were found, with the darker blobs show the bigger bricks. For convenience of plotting, the sizes were grouped into five bands, each spanning an interval of 0.4 litres. The map clearly shows the tendency for bigger bricks to be found further north.
The GB coastline is reproduced from Ordnance Survey map data by permission of the Ordnance Survey © Crown copyright 2010
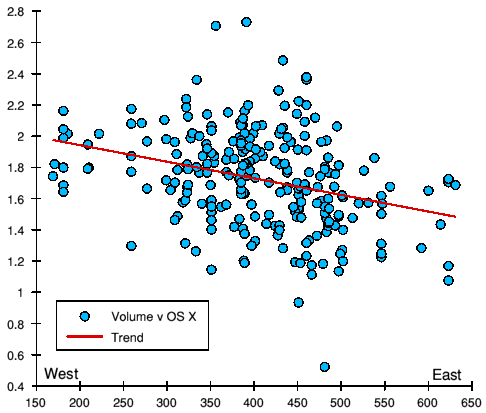
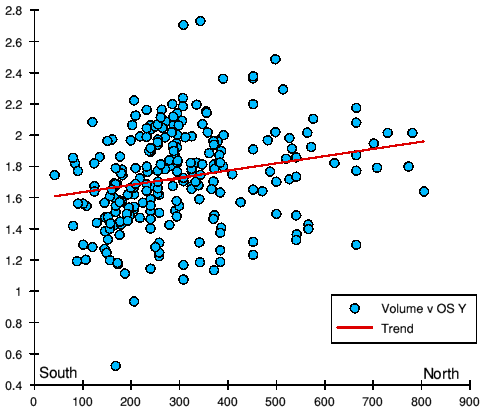
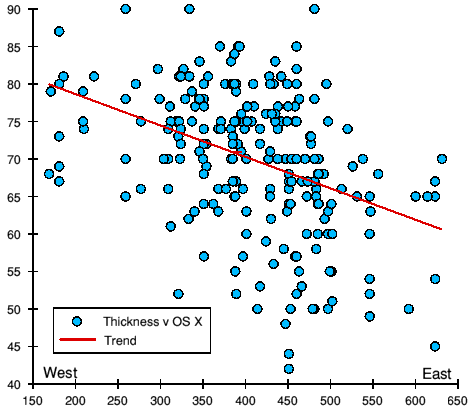
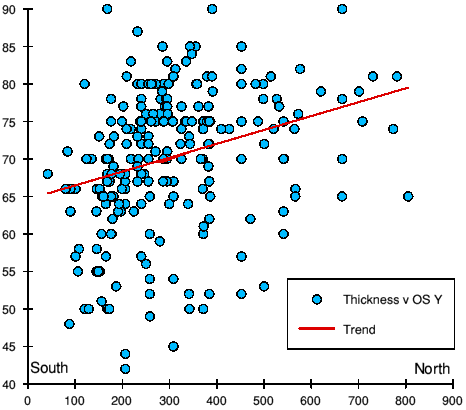
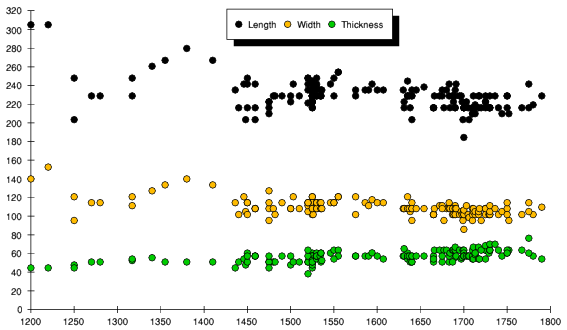
The graphs below show brick volume plotted against the OS easting and northing coordinate. There is a lot of variation but the trend line, shown red, shows that volume increases with distance north and west.
The shape of the bricks also tends to vary, and thickness accounts for more of the size difference than length or width. The thickness of the bricks I measured ranged from 42mm to 90mm, a ratio of 2.1 between thickest and thinnest. The thickness of a standard modern brick is 65±3mm (ie 62-68mm).
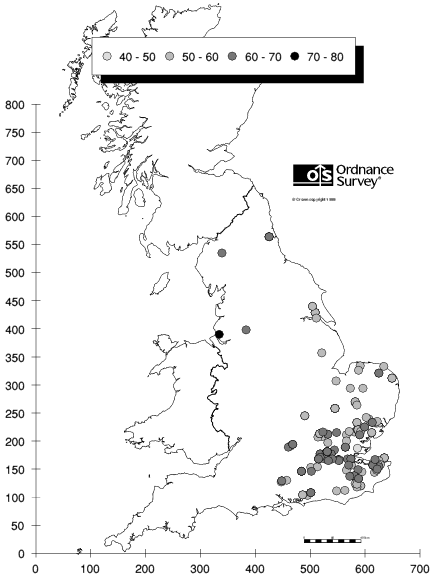
The map shows where the bricks were found, with the darker blobs being the thicker bricks. For plotting, the sizes were grouped into five bands, each spanning an interval of 10mm. The map clearly shows the tendency for thicker bricks to be found further north.
The GB coastline is reproduced from Ordnance Survey map data by permission of the Ordnance Survey © Crown copyright 2010
The graphs below shows brick thickness plotted against the OS easting and northing coordinate. There is a lot of variation but the trend line, shown red, shows that thickness increases with distance north and west.
Dimensional variation
The geographic plots are grouped in size bands and don't show how the individual dimensions relate to each other. The plots below show the actual measurements plotted against each other in pairs, so as to illustrate the variation in shape as well as size. In each graph, the dimensions of a standard modern brick are shown as a grey line representing the standard dimensions and tolerances.
Width v length
 The bricks I measured had widths ranging from 90 to 126mm, and lengths ranging from 175 to 270mm, ie much bigger and smaller than a standard modern brick, which is 102.5 to 225mm.
The two examples from my collection shown here measure 108x230mm and 80x200mm respectively.
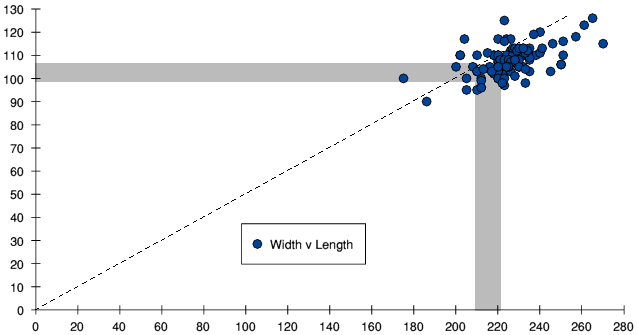
Across the sample, there was quite a strong correlation between width and length, as you would expect, since when laid in a wall, two headers and a layer of mortar should take the same space as a stretcher, ie the width should be just under half the length. The graph shows this correlation (the dotted line shows a ratio of 2:1).
Thickness v width 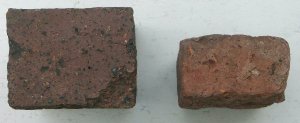
The bricks I measured had thicknesses ranging from 42 to 90mm and widths ranging from 90126mm. These compare with 65mm and 102.5mm for a standard modern brick.
The two examples from my collection shown here measure 86x108mm and 50x80mm respectively.
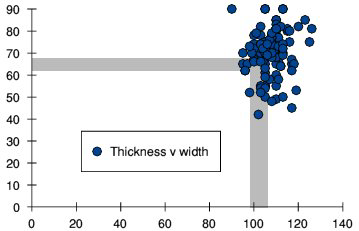
There is more variation in thickness than in width, and very little correlation between them, as the graph shows.
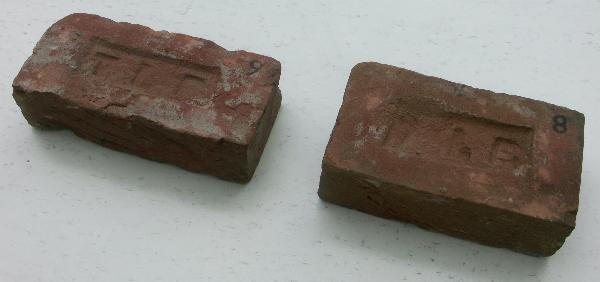
Thickness v length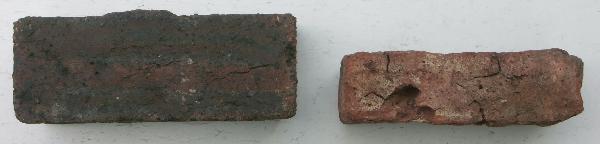
The bricks I measured had thicknesses ranging from 42 to 90mm and lengths ranging from 175 to 270mm. These compare with 65mm and 215mm for a standard modern brick.
The two examples from my collection shown here measure 86x230mm and 50x200mm respectively.
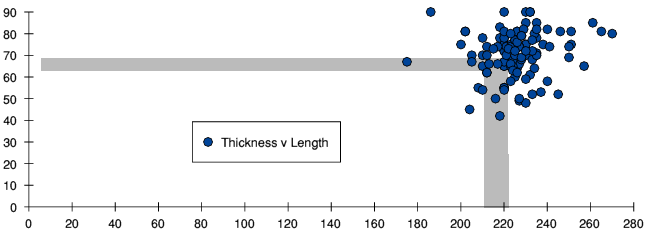
Thickness and length vary by similar amounts, but the proportional variation in thickness is much greater (a factor of 2.1 between extremes) than in length (a factor of 1.5 between extremes) and there is very little evidence of correlation between the two.
Manufacturing tolerances
Not all variability is due to manufacturers using different sizes. Some is due to variability in the manufacturing process.
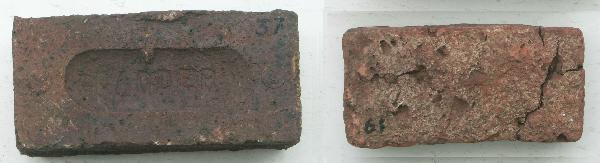
In the modern specification, the 'T1' tolerance (the least stringent) allows ±3mm in thickness, ±4mm in width, and ±6mm in length. Historically, much more variation can be found. For example, the pair of bricks shown here were made by the same company, Thomas Lawrence of Bracknell (TLB), and they are almost certainly contemporary, since they were found in the same rubble heap.
Analysis of Lloyd's data
Nathaniel Lloyd's 1925 book A History of English Brickwork includes the sizes of over 150 different bricks in buildings across England dating from 1050 to 1790, ie 700 years ending just after the brick tax was imposed in 1784. I plotted these values to see whether there was any pattern in these much earlier bricks.
Some of the dates given are exact, but some are more vague. Where Lloyd gave a range, I took the mid value. Where he just specified the century, I used the mid-date, ie xx50. Where it said 'early' or 'late' in the century, I used xx25 or xx75 respectively.
 Dimensions – Plotting length, width and thickness shows that from around 1430 to 1780. there is no consistent variation, just random variation. Length and width (but not thickness) appear to rise and then fall during the previous century but with so few data points that might not be reliable.
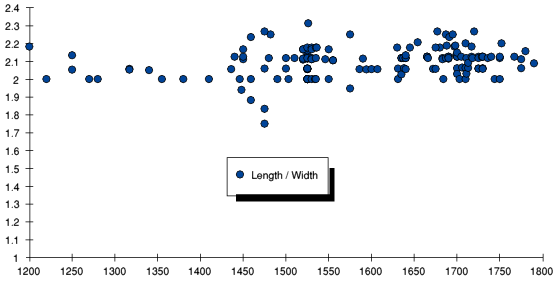 Length to width – Plotting the ratio of length to width showed it was mostly just over 2, as expected, with around 10% random variation during the period where there are enough data points to show it, but no consistent variation with date.
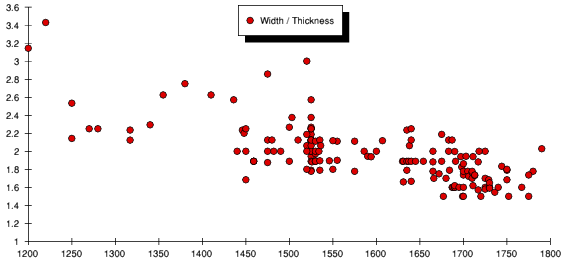 Width to thickness – Plotting the ratio of width to thickness shows a lot of variability. Prior to 1450, the limited data appear to show a rise after 1350, Between 1450 and 1800 there is a lot of variability but a very slight downward trend in the average from around 2 to somewhat under 2. In other words, when viewing the headers, bricks became very slightly more square in cross section .
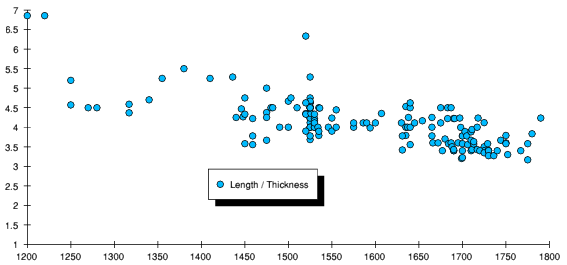 Length to thickness – Plotting the ratio of lenth to thickness shows a similar pattern (but not quite). Prior to 1450, the limited data appear to show a rise after 1350, and between 1450 and 1800 there is a lot of variability with a very slight downward trend in the average from well over 4 to well under 4. In other words, when viewing the stretchers, bricks became slightly less elongated.
 This plot shows the volume of bricks listed by Lloyd at different locations, from 0.8 to 2.4 litres, in 0.4 litre bands. As expected for early buildings, most of the samples are in the south east, and there is no obvious pattern to the spread of sizes.
 The final diagram plots thickness in 10 mm bands from 40mm to 80mm. Again, there is no obvious pattern in the distribution of sizes.
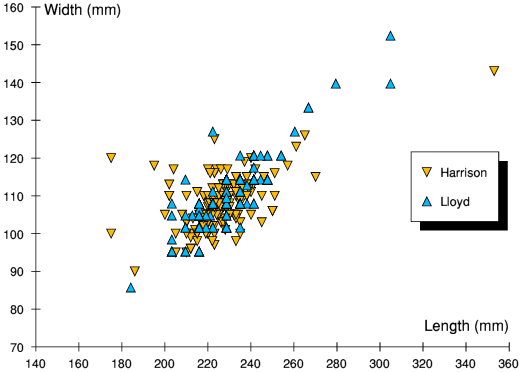 It is interesting to compare the range of sizes in Lloyd's record with my observations. The graph shows a plot of width v length. The main clusters of both are similar, but Lloyd's data included more bricks significantly larger than the main cluster. There is also a noticeable difference in the outliers in terms of the ratio of length to width. In Lloyd's data none fall outside the range of approximately 1.7 to 2.15, whereas my observations included some extreme ratios of under 1.5 and nearly 2.5.
See also my talk on brickwork .